Overview
KomPlot provides a convenience layer around selected matplotlib plotting functions, making it possible to construct a useful plot in a single function call, which is particularly useful for use within an interactive ipython or JupyterLab session. KomPlot also provides a number of interactive controls, including zooming by mouse wheel scroll, colormap shifts when viewing images, and shifting between displayed slices of a volume.
Plot Types
KomPlot supports the following types of plots.
Lines and points in 2D

Plotting of lines and points in 2D is supported by the plot() function. A usage example is available.
Contour plot representation of a 3D surface
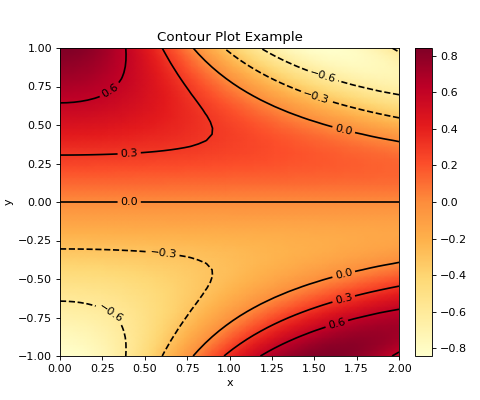
Contour plot representations of a 3D surface are supported by the contour() function. A usage example is available.
Surface plot representation of a 3D surface
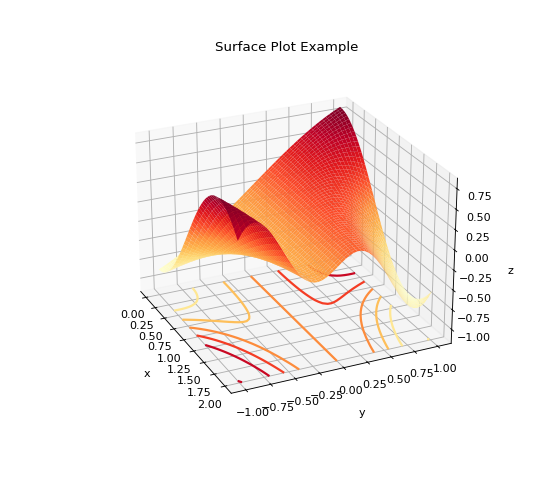
Surface plot representations of a 3D surface are supported by the surface() function. A usage example is available.
Viewer for 2D images
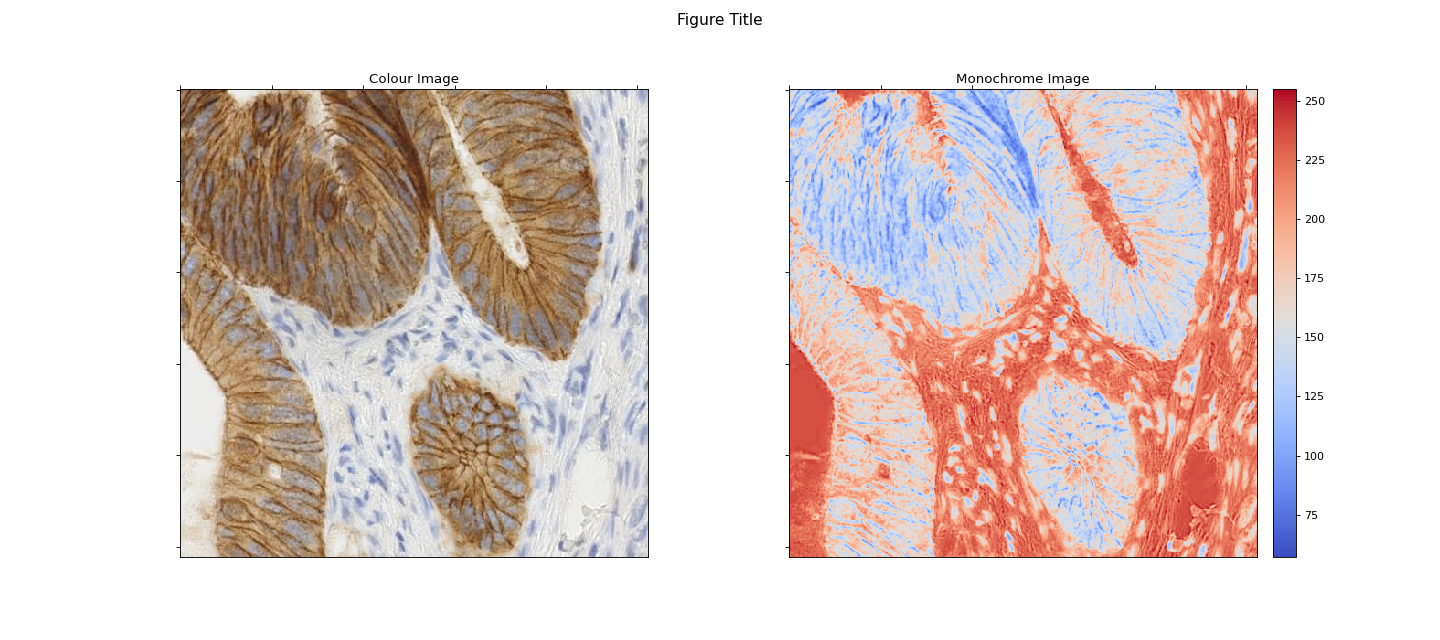
Function imview() provides a viewer for 2D images. A usage example is available.
Viewer for slices of 3D volumes
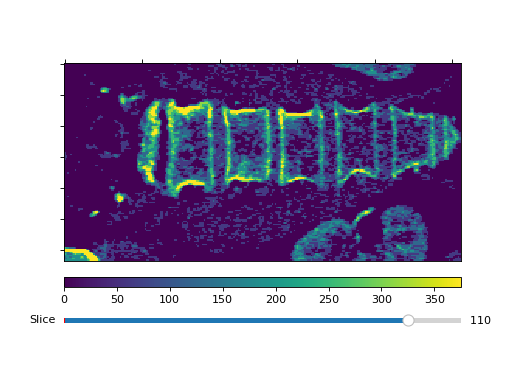
Function volview() provides a viewer for slices of 3D volumes. A usage example is available.
Interactive features
It also provides interactive adjustment/navigation support in addition to the standard matplotlib interactive features:
Action/Key |
Effect |
Valid |
|---|---|---|
q |
Close figure. (This is also a standard keyboard shortcut.) |
All plot types |
PageUp/PageDown |
Increase or decrease figure size by a scaling factor. |
All plot types |
Mouse wheel scroll in main figure |
Zoom in or out at current cursor location. |
All plot types except
|
Mouse wheel scroll in bottom half of colorbar |
Increase or decrease colormap
|
All plots with a visible colorbar |
Mouse wheel scroll in top half of colorbar |
Increase or decrease colormap
|
All plots with a visible colorbar |
Mouse wheel scroll in main figure with Shift depressed |
Increase or decrease slice index. |
A |
Slice slider bar |
Increase or decrease slice index. |
A |
Note that none of the keyboard shortcuts (including detection of the shift key while the mouse wheel is scrolled) are functional within Jupyter notebooks with the ipympl matplotlib backend.
Usage Examples
A number of example scripts, and a Jupyter notebook, illustrating usage are available in the examples directory.